Axioma Metering LoRaWAN Integration with a White-Label Client Portal
Installing Axioma Metering ultrasonic water meters? Datakubo connects to them over LoRaWAN and turns the readings into a clean, branded portal your Communities and Residents can actually use — live consumption, full history, and configurable leak and anomaly alerts.
Axioma builds the metrology. Datakubo adds the software layer on top, under your brand, not ours. Your existing AMR, head-end or billing export keeps running exactly as it does today.

Compatible hardware
Axioma Metering
A European manufacturer of static ultrasonic water meters, best known for the Qalcosonic W1 range. Their meters ship with LoRaWAN radio built in, which is all Datakubo needs.
Datakubo complements your metering stack — it does not replace it
Axioma meters are metrology instruments: approved, sealed, and built to be the legal record of how much water passed through the pipe. Datakubo does not touch that. It sits on top of the same LoRaWAN uplinks and adds what installers get asked for after the meters are on the wall — a white-label Community and Resident portal, live monitoring, configurable anomaly detection, and per-Resident access. Whatever you already use for meter management or billing exports keeps its feed; Datakubo takes a parallel one. The two run side by side.
The Axioma water meters installers bring to Datakubo
Any Axioma water meter that sends LoRaWAN uplinks reaches Datakubo the same way. These are the three variants of the Qalcosonic W1 that show up most often in European water and submetering projects.
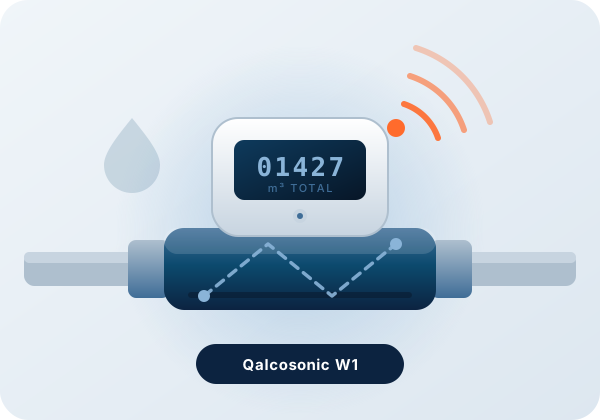
Qalcosonic W1 · DN15–DN20
The apartment and villa workhorse. Static ultrasonic measurement with no moving parts, an internal datalogger, and LoRaWAN radio integrated by default.
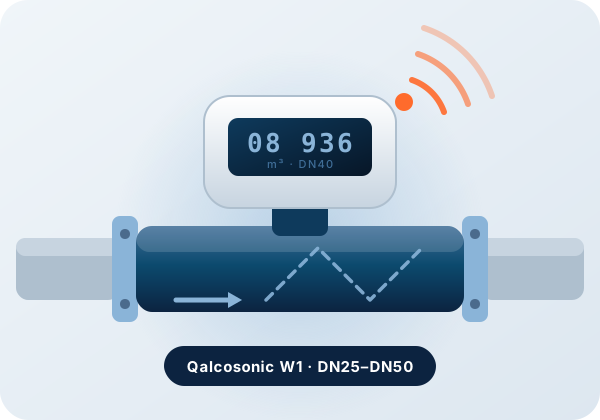
Qalcosonic W1 · DN25–DN50
Building inlets, risers, irrigation headers and shared-well mains. Pair a bulk meter with the apartment meters below it and Datakubo shows you the gap between them.
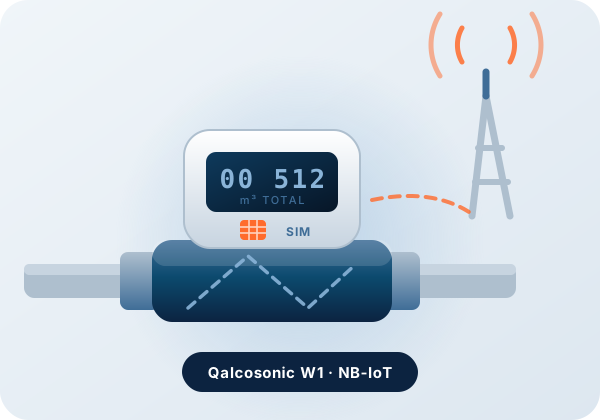
Qalcosonic W1 · NB-IoT
The same meter, no gateway. It posts over the cellular network instead of LoRaWAN — the answer for scattered rural sites where one gateway would cover a single meter.
Supported Axioma water meters
Datakubo works with any Axioma water meter that can deliver decoded uplinks through a LoRaWAN network server, an all-in-one gateway, or a direct HTTP feed. These are the variants installers deploy most:
| Model | Application | Connectivity | Notes |
|---|---|---|---|
| Qalcosonic W1 | Cold and hot water, DN15–DN20 | LoRaWAN + wireless M-Bus | The standard apartment and household meter. Both radio protocols can run at the same time, so a wM-Bus walk-by route and a Datakubo LoRaWAN feed can coexist. |
| Qalcosonic W1 (DN25–DN50) | Bulk lines, risers, irrigation | LoRaWAN + wireless M-Bus | Larger bore version of the same platform. Use it as the parent meter in a zone hierarchy to catch losses between the inlet and the sum of the apartments. |
| Qalcosonic W1 NB-IoT | Sites with no LoRaWAN coverage | NB-IoT | Reaches Datakubo through the HTTP ingest instead of a LoRaWAN network server — no gateway to install, at the cost of a SIM per meter. |
| Other Axioma LoRaWAN water meters | Mixed and legacy fleets | LoRaWAN | If it reports through ChirpStack, The Things Network or a gateway with a built-in network server, it lands in the same portal — including fleets that mix Axioma with B Meters and other brands. |
How the data reaches your portal
Nothing about the LoRaWAN path changes. The meter sends its uplink, a gateway picks it up, and your network server decodes it — exactly as it does today. Datakubo is added as one more integration on that network server, so the same uplink is delivered twice: once to whatever you already run, once to Datakubo.
Datakubo normalizes the payload on arrival, so an Axioma meter behind ChirpStack, an Axioma meter behind an all-in-one gateway, and a B Meters unit behind The Things Network all show up in the same fleet view, with the same charts and the same alert rules.
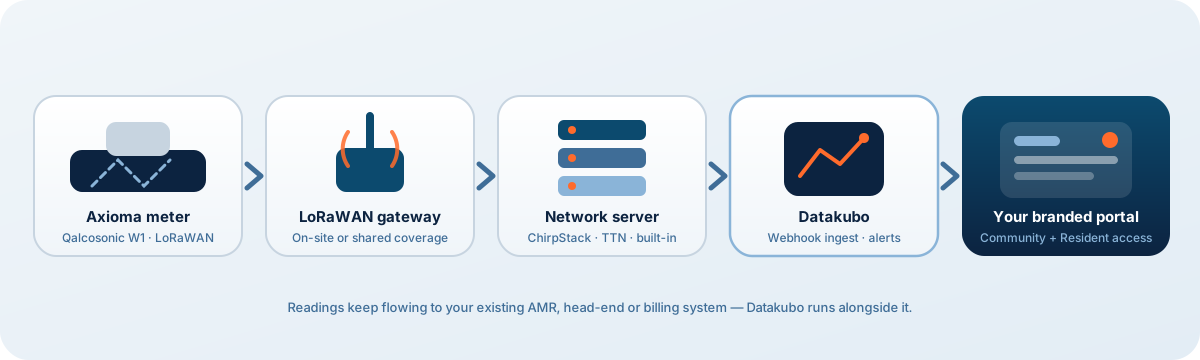
How to add your Axioma meters to Datakubo
Plan on well under an hour for the first site, and a couple of minutes per meter after that. Steps 1–3 happen on the meter and the network server; steps 4–7 happen inside Datakubo.
Commission the meter and keep its LoRaWAN credentials
Each meter carries its DevEUI on the label; the JoinEUI/AppEUI and AppKey arrive in the delivery file from your supplier. Use the NFC or optical interface to wake the meter, confirm the region is EU868, and set the uplink interval you want — hourly is the usual choice for submetering. Keep the delivery file: it is what you import next.
Register the meters on your LoRaWAN network server
In ChirpStack or The Things Network, create a device profile for the Qalcosonic (Class A, EU868) and add each DevEUI with its AppKey. OTAA and ABP both work. If you run an all-in-one gateway with an embedded network server, do the same in the gateway’s own web interface — there is no separate network server to host.
Add the payload decoder
Paste the manufacturer’s Qalcosonic JavaScript decoder into the device profile so uplinks arrive as cumulative volume, hourly deltas and a status byte rather than raw bytes. Datakubo’s webhook only recognizes specific field names for that volume reading, though — check the webhook field mapping and rename the decoder’s output to cumulativeFlowM3 (cubic meters) and battery (voltage) if it doesn’t already use those names, the same way B Meters’ water field is mapped. Datakubo also normalizes payloads on ingest, so you can connect first and fix field names afterwards without losing readings.
Point the network server at Datakubo
In ChirpStack add an HTTP integration; in The Things Network add a webhook; on an all-in-one gateway use its HTTP forwarding page. Paste your Datakubo ingest URL and API key. This is an additional integration, not a replacement — anything you already forward to an AMR, head-end or billing tool keeps flowing.
Confirm the meters in Datakubo
Devices appear in Datakubo automatically on their first uplink. Check that the totalizer matches the reading on the meter’s own LCD, then give each meter a name a human will recognise — apartment 3B, irrigation header, block C riser.
Build the Community and assign Residents
Create the Community, arrange the meters into zones (site → riser → apartment), and assign each meter to its Resident. The hierarchy is what makes a continuous-flow alert say which part of the site the leak is in, instead of just which meter.
Brand it and invite everyone in
Add your logo and colours, then invite the Community manager and each Resident by email. They sign in and see only what belongs to them — under your brand, not Datakubo’s.
The alarms an Axioma meter already sends — turned into alerts
Every Qalcosonic uplink carries a status byte alongside the volume. Datakubo reads it, keeps the history, and raises an alert to the people who need it. Thresholds and who gets notified are configurable per Community.
- Leak — continuous low flow over a window you define, the pattern behind most silent losses
- Burst — abnormally high flow that needs someone on site today, not at the next reading
- Backflow — reverse flow through the meter, worth investigating on shared-well and irrigation lines
- Empty pipe — the meter is measuring air, typically a supply cut or a drained riser
- Tamper — magnetic interference and other fraud flags raised by the meter itself
- Freeze risk — low-temperature warning before the pipework is the one that tells you
- Low battery — planned replacement instead of a meter that silently stops reporting
- Meter offline — Datakubo’s own check for uplinks that stopped arriving, which no meter can report about itself
What your Communities and Residents see
Once a meter is assigned, the Community manager sees every meter on the site — daily and monthly consumption, per-meter history, zone totals, and any open alerts. Each Resident gets a private view of their own consumption and trends, plus a heads-up when something looks off, like continuous flow that points to a possible leak. No spreadsheets, no walk-by routes to schedule, and nothing technical to learn.
Why installers pair Axioma hardware with Datakubo
Ultrasonic meters solve the measurement problem. They do not solve the "my client wants to see it" problem — and that is the one that decides whether a project gets renewed. Datakubo is built for everyone who is not a meter engineer: the Community manager who needs an overview of the whole site, and the Resident who just wants to know why this month looks high. You keep the manufacturer relationship, the hardware margin, and the billing workflow you have. You add a portal with your name on it, per-Resident access, and alerts that reach people while a leak is still cheap to fix.
Frequently asked questions
Do I need Axioma’s own software to use Datakubo?
No. Datakubo reads the LoRaWAN uplink through your network server, so it works whether or not you run the manufacturer’s configuration or reading tools. If you do use them, nothing changes — the meter can feed both.
Does Datakubo replace my billing or AMR system?
No, and it is not designed to. Your AMR, head-end or billing export stays the source of truth for invoicing. Datakubo adds the branded monitoring layer on top: live consumption, zone hierarchies, configurable anomaly alerts, and per-Resident logins.
Which LoRaWAN network server do I need?
Whichever you already use. ChirpStack and The Things Network are the most common, and all-in-one gateways with an embedded network server work too — they expose the same HTTP forwarding. Datakubo receives the decoded uplink over a webhook in every case.
What about the NB-IoT version of the Qalcosonic W1?
It works, and it skips the gateway entirely: the meter posts to Datakubo’s HTTP ingest over the cellular network. It is the right choice for scattered sites where a LoRaWAN gateway would cover only one or two meters, and the wrong choice for a dense building where a single gateway serves the lot.
Can I mix Axioma with other meter brands in the same portal?
Yes. Datakubo normalizes payloads on ingest, so Axioma meters, B Meters units and any other LoRaWAN meter appear in one fleet view with the same charts and the same alert rules. Mixed fleets are the normal case, not the exception.
Is the Resident portal available in Spanish?
Yes — the portal ships in English and Spanish, and it carries your branding in both. Residents see the language they choose, not the one the installer works in.
My meter shows up in Datakubo but has no readings — why?
Almost always a field name mismatch in the payload decoder. Datakubo’s webhook only recognizes specific field names for volume and battery — see the full reference at datakubo.com/docs/webhook-integration, or paste the webhook into our payload decoder at datakubo.com/tools/lorawan-payload-decoder and it will name the field and the rename. If the Qalcosonic decoder’s output doesn’t already use those names, rename the fields in the decoder script and readings will start flowing on the next uplink.
Keep reading
- B Meters LoRaWAN integration
- All-in-one LoRaWAN gateway integration
- Webhook integration docs — full payload field mapping
- Payload decoder — paste a webhook and check the field names
- Water meter monitoring for installers
- Water leak detection
- Water submetering
- Case study: how AquaLinks won Best Product at ExpoEbre 2025
Axioma Metering and Qalcosonic are trademarks of their respective owners. Datakubo is an independent platform and is not affiliated with, endorsed by, or certified by Axioma Metering. Compatibility is described from the LoRaWAN side: any meter that delivers decoded uplinks to a network server can be connected. Illustrations on this page are original artwork, not product photography.